21 Oct 2026
How Walking Routines Reveal Shifts in Daily Social Patterns Across Cities
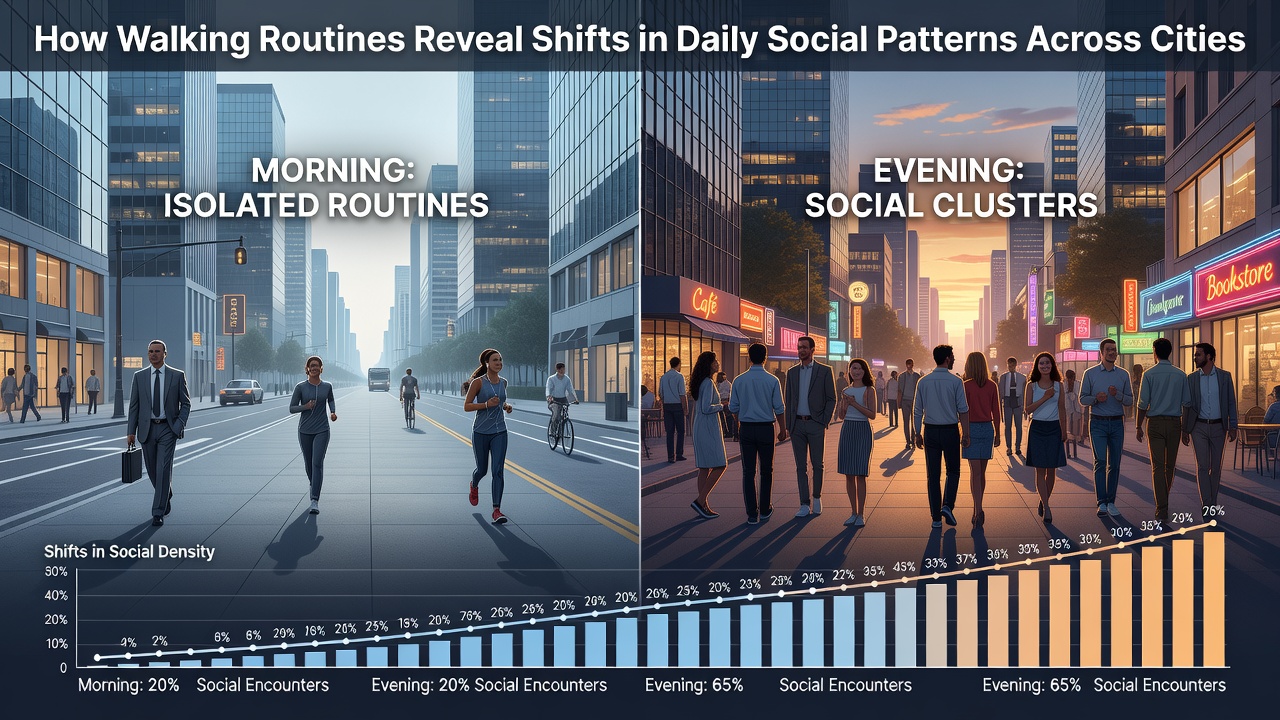
Urban researchers track pedestrian flows through sensors and mobility apps to map how daily walking patterns reflect broader changes in work schedules, social gatherings, and community interactions across major metropolitan areas. Data collected from citywide monitoring systems shows that peak walking times have shifted in many locations since the widespread adoption of hybrid work arrangements, with midday foot traffic rising while traditional morning rush hours see reduced volumes in downtown cores.
Tracking Mobility Through Routine Data
Public transportation authorities and academic teams compile anonymized GPS records along with pedestrian counter readings to identify trends in when residents leave homes for exercise, errands, or meetings. In cities such as Singapore and Toronto, these datasets reveal that evening group walks have increased among younger adults, while solo midday strolls dominate among remote workers. Figures from the Australian Institute of Health and Welfare demonstrate similar patterns in Melbourne, where average daily step counts per resident rose by 12 percent between 2023 and 2025, accompanied by more dispersed timing throughout daylight hours rather than concentrated commutes.
City planners note that these adjustments coincide with expanded outdoor seating in commercial districts and new green corridors that encourage spontaneous encounters. Observers point out that neighborhoods once quiet after 9 a.m. now sustain steady foot traffic as flexible schedules allow residents to combine exercise with brief social stops at cafes or parks.
Regional Variations in Walking Behaviors
European cities display distinct rhythms compared with North American counterparts. In Barcelona and Amsterdam, municipal reports indicate sustained high volumes of family-oriented walks on weekends, supported by car-free zones that expanded during the previous decade. Meanwhile, data released in October 2026 by the European Environment Agency highlights a measurable uptick in inter-neighborhood walking trips in several capitals, attributed to improved bike-and-walk infrastructure that connects residential zones with employment hubs.
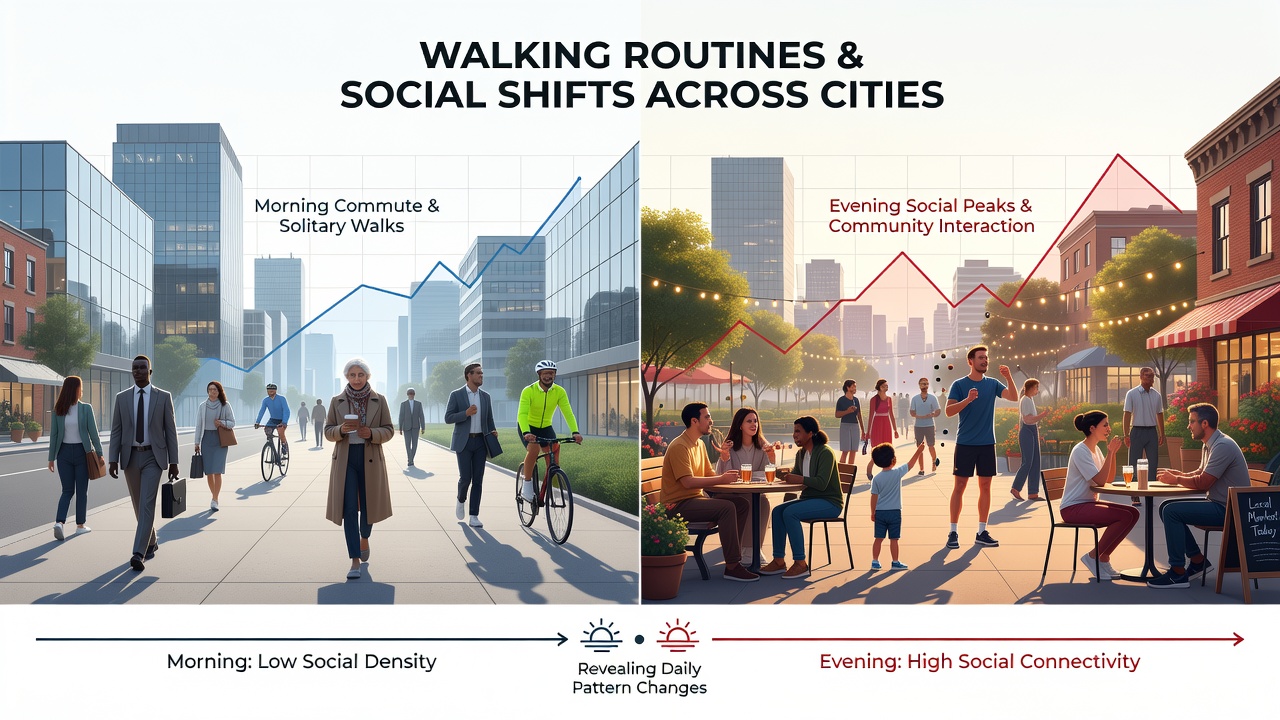
North American analyses from the U.S. Department of Transportation show parallel developments in places like Portland and Chicago, where sensor networks record longer average walk durations on weekdays. Researchers attribute this to combined trips that blend physical activity with visits to local businesses or community events. In contrast, high-density Asian centers such as Seoul and Taipei exhibit tighter clustering of walking activity around transit hubs during early morning and late afternoon, though weekend patterns have grown more flexible following policy changes that promote pedestrian-only streets.
Technology and Social Pattern Detection
Mobile applications and wearable devices supply granular detail on stride length, pace, and route choice, allowing analysts to differentiate between purposeful commuting walks and leisurely social outings. Studies published by research teams at the University of British Columbia link increased evening walking clusters to the growth of neighborhood walking groups organized through digital platforms. These tools also capture seasonal fluctuations, with October 2026 records showing elevated participation in structured walking events across temperate climate zones as daylight saving adjustments alter available light for after-work movement.
Public health agencies integrate these mobility metrics with social survey responses to examine correlations between walking frequency and reported community cohesion. In Canadian provinces, Statistics Canada data connects higher neighborhood walkability scores with measurable increases in informal resident interactions at shared outdoor spaces.
Implications for Urban Planning
Municipal governments use the accumulated walking data to adjust infrastructure investments, such as widening sidewalks near schools or adding lighting along popular evening routes. Planners in multiple regions report that real-time dashboards now inform decisions on temporary street closures for markets or festivals, timed to coincide with documented peaks in social walking activity. The resulting layouts support both individual exercise goals and opportunities for spontaneous conversations among neighbors.
Longitudinal comparisons spanning five years indicate that cities investing in mixed-use pathways experience steadier year-round pedestrian volumes, whereas areas lacking such features show sharper drops during colder months. These patterns continue to guide funding allocations for public space improvements worldwide.
Conclusion
Walking routine analysis supplies city officials and sociologists with concrete indicators of evolving daily rhythms and social structures. Continued integration of sensor networks, public datasets, and academic reviews promises further refinement of these insights, enabling responsive urban design that aligns with observed human movement across diverse metropolitan settings.